Too many email metrics and not enough insight? It can be confusing. Here’s a list of email metrics that marketers are often told to use:
- Open, click, and click-to-open rates
- Hard and soft bounce rates
- Unsubscribe and complaint rates
- List size and list growth rate
- Inbox placement
- Delivery rate
- Conversion rate
- Revenue and revenue per email
- Sessions
- Sent volume
- Read rate
- Read device; desktop/mobile
- Spam score
- Sender score
- Replies, forwards, and social shares
- Open and click reach
- Engagement duration
It’s not so easy, as an article with views on the email metrics that matter from nine experts shows. I’ll save you reading. TL;DR they didn’t agree on the metrics.
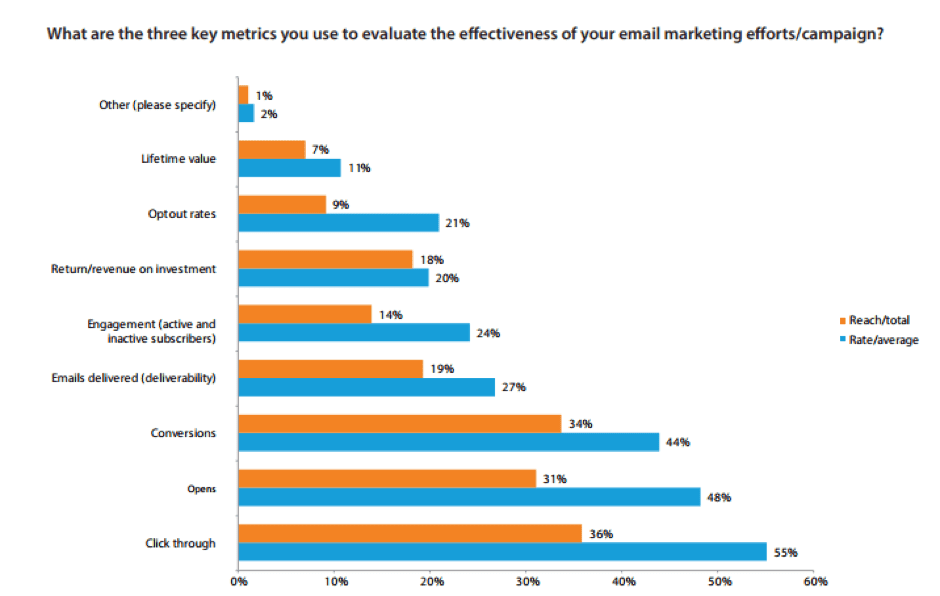
Or take the wisdom of crowds, with this chart below from the DMA 2018 marketer email tracker.
I’d be surprised if many CFOs and CEOs felt open rate was more important than revenue. I can hear the CFO now: “Open what?”
The problem is we haven’t been clear about the question. The starting point is to consider the purpose of the metric.
Let me take you on a journey, almost literally. Imagine you’ve spent the day at the theme park and need to get home, some two hours away for a 7:00 p.m. dinner date. You set off in your car in beautiful sunshine.
There are many metrics you’ll have to track as you drive:
- Amount of fuel left
- Distance traveled
- Engine temperature
- Engine revs
- Oil pressure
- Current speed
- Tire pressure
- Temperature inside the car
After all, if you run out of fuel, you’ll not be making your dinner date.
However, all the above metrics are process metrics. None of them represent the real purpose of the journey, your business metrics.
The business metrics are how close to 7:00 p.m. we arrive and the number of people who arrive—whether everyone who starts the journey safely arrives. We’ll have failed if we lose some people along the way!
Email Business and Process Metrics
There is a difference between the metrics that are closely aligned with business success and those that are to help manage the everyday campaign process.
How does this apply to email marketing?
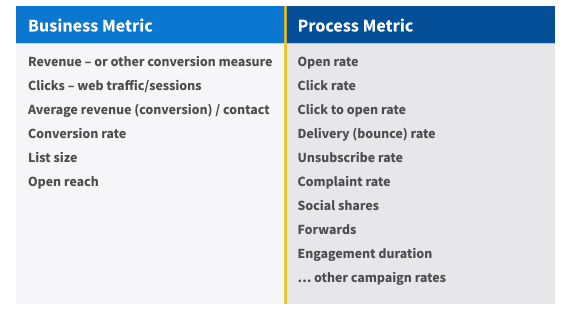
The table below divides the common email metrics into business and process metrics.


No surprise the number one business metric will, in most cases, be revenue. If revenue can’t be measured, look for the next best thing, perhaps the number of hot leads identified or quote requests.
The metrics on the left generally are measuring the email channel and are mostly not percentages. These are KPIs to track and review over a period of time, almost certainly monthly, though it could be weekly or quarterly in some businesses.
Those on the right are aligned to campaign metrics rather than the email channel performance as a whole and are mostly percentages (rates).
The point is, if the business metrics are stable or trending up then you can be confident the email channel is healthy and growing. You almost don’t need to review the process metrics if the business metrics are solid. The process metrics are there to diagnose and avert problems, much like the fuel running out or engine overheating in our earlier journey. Or aid in improving channel performance. But never focus on just increasing one or two of the process metrics.
One metric that you may not be so familiar with is open reach. It sounds like open rate, but it’s very different. It’s the number of unique contacts that have opened one or more emails in the month.
Whilst it sounds much like open rate, it’s quite different. Open reach can go up even if open rate goes down. This study about the right email frequency shows just how a decreasing open rate can still mean higher business metrics.
Open reach helps answer the question, “My open rate is always about 22%, but I just don’t know if it’s the same 22% or a different set of people each time.” It shows the number of contacts across the whole database engaging with email.
Percentages Are Dangerous
Open rates, in particular, continue to get a great deal of focus. But all comparisons around rates need care.
Here are two campaigns: a big deal and a huge deal. Which one is better?


The huge deal looks stronger: higher open, higher click and even higher click-to-open rate (CTOR). Must be a winner.
Adding some absolute values rather than percentage rates gives a different picture.


The big deal had 588 subscribers visit the website rather than 245. Assuming the conversion rate on the web is the same, then the big deal drove more revenue. More successful in business terms.
When looking at percentages, always check the absolute numbers too.
What’s Right for You
Ultimately, the business metrics and process metrics you use should be tailored to your business. If free trials are key to what drives your business, then that could be one or your business metrics, or if you heavily invest in list growth via PPC then cost per new contact could be an important business metric.
If your product or service isn’t a heavily social experience then social shares may not be a process metric worth watching.
Be careful of giving focus on email metrics for things you can’t influence; it’s very unlikely to be a good business metric. For example, the number of people reading on iPhone vs. Android devices.
And finally, take care with vanity metrics. It may feel good to see increasing open rates, but if that’s by limiting segments, changing frequency and mischievous subject lines that don’t lead to conversions, then it was all show and no substance.


